Todd Mitchell
GEOG-499c
|
Lab 7: Image Analysis |
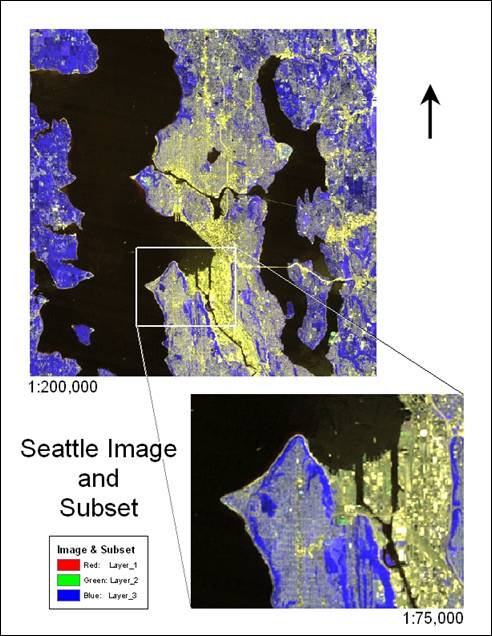
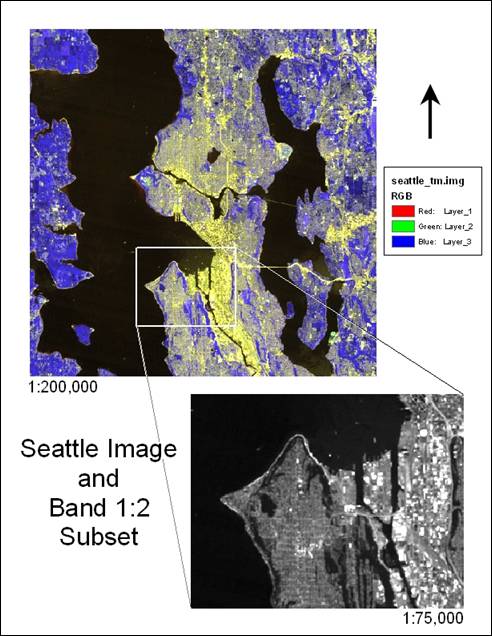
1. What is the difference between spatial subsetting and spectral subsetting?
Spatial subsetting allows one to isolate a spatial copy of the original image. Spectral
subsetting allows one to isolate a band or band
combinations from the original image.
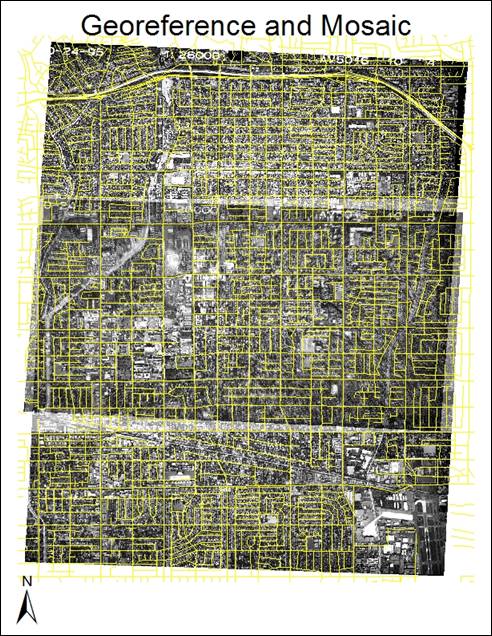
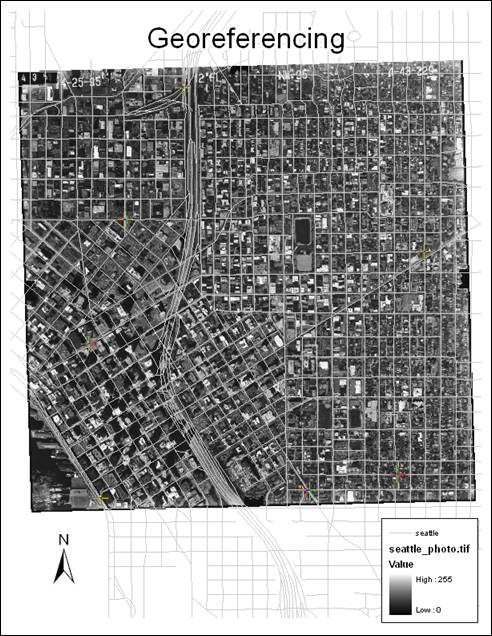
2. Whatís georeferencing?
Georeferencing is the process of assigning spatial coordinates to corresponding cells in a raster (image-to-map)
or points in a non-referenced vector (map-to-map). The projected data in a shape file can be
used to align a remotely sensed image, by choosing control points in the image
and mapping them to corresponding points in the shape file.
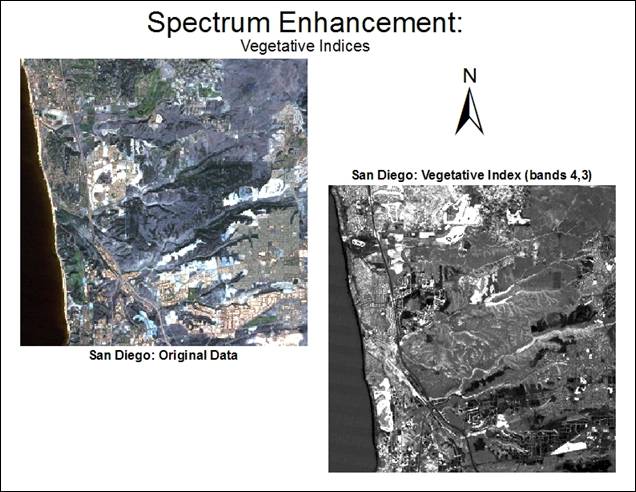
3. In exercise 7, compare the input and output image (Hand-in
7). What does the output image tell you?
This shows the maximum and minimum areas of
vegetation. The white areas correspond
to rich vegetation in the original image, whereas the black areas correspond to
areas of little vegetation.
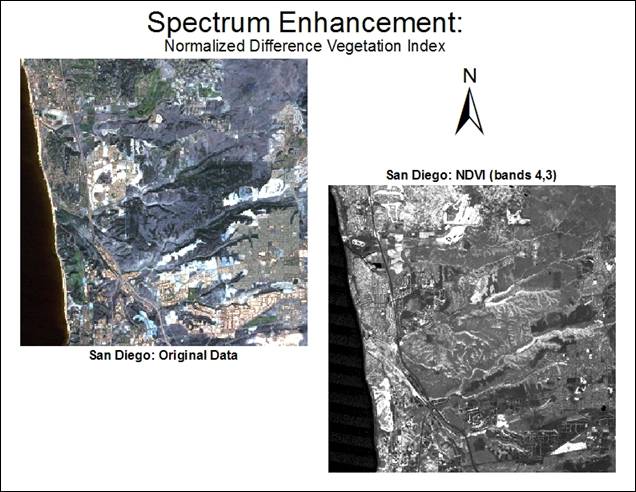
4. In exercise 7, compare the two output images (Hand-in 7 and
Hand-in 8), what differences can you observe?
The
first output was a vegetative index and the second output was a normalized
difference vegetative index (NDVI). The
NDVI is less contrasty than the regular vegetative
index, and shows dark features (water bodies) in the middle of areas of low
vegetation very well. The regular
vegetative index gives a general idea of overall vegetation, but normalizing
the data can be helpful especially in areas where vegetation falls off
drastically.
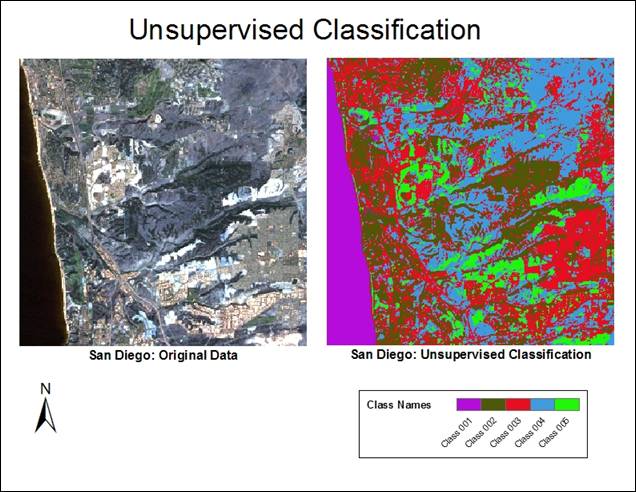
5. In Exercise 8, can you try to give the type of landuses for the five categories in output image (Hand-in
9)?
Because this was an unsupervised classification,
most classifications overlap into others. However, the following generalizations can be made.
Class 001: magenta ñ water
Class 002: ochre ñ areas of low vegetation, including
brush and chaparral
Class 003: red ñ residential built up, including landscaped
areas
Class 004: light blue ñ rich vegetation
Class 005: green ñ heavy built up areas (and areas with
the most reflectivity from the original data)
Hand-In 1
Hand-In 2
Hand-In 3
Hand-In 4
Hand-In 5
Hand-In 6
Hand-In 7
Hand-In 8
Hand-In 9
Hand-In 10
Hand-In 11